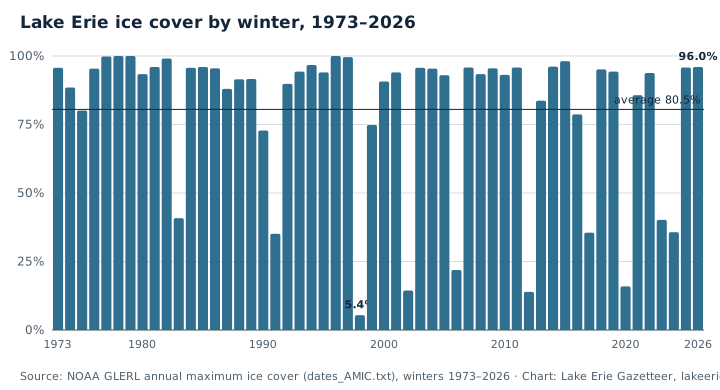
The largest share of the lake frozen in each winter, from NOAA GLERL.
The largest share of the lake frozen in each winter, from NOAA GLERL. Embed this chartData table for this chart
Lake Erie annual maximum ice cover by winter (year the winter ended). Source: NOAA GLERL.
Winter ending
Maximum ice cover
Date
1973
95.7%
Feb-27
1974
88.5%
Feb-21
1975
80.1%
Feb-13
1976
95.4%
Feb-08
1977
99.8%
Feb-08
1978
100.0%
Feb-08
1979
100.0%
Feb-12
1980
93.4%
Mar-05
1981
96.0%
Jan-14
1982
99.1%
Feb-15
1983
40.8%
Feb-14
1984
95.7%
Jan-18
1985
96.0%
Feb-09
1986
95.5%
Feb-01
1987
88.0%
Feb-14
1988
91.5%
Feb-07
1989
91.6%
Feb-17
1990
72.8%
Mar-09
1991
35.1%
Feb-01
1992
89.8%
Feb-16
1993
94.3%
Feb-24
1994
96.7%
Feb-09
1995
94.0%
Feb-13
1996
100.0%
Feb-05
1997
99.6%
Feb-02
1998
5.4%
Jan-23
1999
74.8%
Jan-15
2000
90.7%
Feb-01
2001
94.0%
Feb-12
2002
14.4%
Jan-03
2003
95.7%
Jan-27
2004
95.4%
Feb-02
2005
93.0%
Feb-07
2006
21.9%
Mar-02
2007
95.8%
Feb-19
2008
93.4%
Mar-10
2009
95.5%
Feb-05
2010
93.1%
Feb-08
2011
95.8%
Feb-01
2012
13.9%
Jan-21
2013
83.7%
Feb-22
2014
96.1%
Mar-06
2015
98.1%
Feb-18
2016
78.7%
Feb-15
2017
35.5%
Feb-08
2018
95.1%
Feb-09
2019
94.3%
Mar-02
2020
15.9%
Feb-29
2021
85.7%
Feb-20
2022
93.8%
Jan-31
2023
40.2%
Feb-05
2024
35.7%
Jan-22
2025
95.8%
Feb-20
2026
96.0%
Feb-05
Use this chart on your site
Use our charts on your site: copy the embed code, which includes a credit link. The chart is free to reuse under Creative Commons Attribution 4.0; the NOAA and EPA values behind it are public domain.