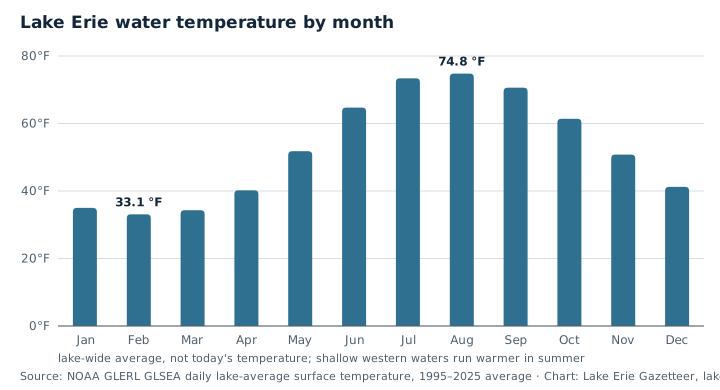
Average lake-wide surface temperature for each month, 1995–2025, from NOAA GLERL.
Average lake-wide surface temperature for each month, 1995–2025, from NOAA GLERL. Embed this chartData table for this chart
Average lake-wide surface temperature, 1995–2025 (lake-wide average, not today's temperature; shallow western waters run warmer in summer). Source: NOAA GLERL GLSEA.
Month
°F
°C
January
35.0 °F
1.7 °C
February
33.1 °F
0.6 °C
March
34.3 °F
1.3 °C
April
40.2 °F
4.6 °C
May
51.8 °F
11.0 °C
June
64.7 °F
18.1 °C
July
73.4 °F
23.0 °C
August
74.8 °F
23.8 °C
September
70.6 °F
21.4 °C
October
61.4 °F
16.3 °C
November
50.8 °F
10.4 °C
December
41.2 °F
5.1 °C
Use this chart on your site
Use our charts on your site: copy the embed code, which includes a credit link. The chart is free to reuse under Creative Commons Attribution 4.0; the NOAA and EPA values behind it are public domain.